This report compiles 150 data‑driven statistics about Google Chrome and its broader ecosystem. Like our earlier WordPress, ChatGPT, Spotify and Steam reports, every statistic is backed by a reliable source and organized into logical sections. Key topics include global adoption, regional market share, user behaviour, extension ecosystem, Chrome OS and Chromebook sales, search patterns, privacy and technology adoption.
Summary of Key Statistic Categories
- Global adoption & market share: Chrome’s share across desktops, mobiles and tablets, year‑over‑year growth and overall user base.
- Regional & demographic insights: Breakdown of market share by country, state and platform loyalty patterns.
- Chrome extension ecosystem: Number of extensions, category distribution, installation counts and security incidents.
- Chrome OS & Chromebooks: Shipments, market value, education adoption and vendor competition.
- Device & usage patterns: Mobile vs desktop usage, private‑browsing habits, multi‑browser use and web technology adoption.
- Chrome’s influence on search & browsing: How Chrome affects search frequency, Discover and autocomplete behaviour.
- Security & privacy: Privacy sandbox adoption, tracker blocking, high‑risk extensions and emerging threats.
Global Adoption & Market Share
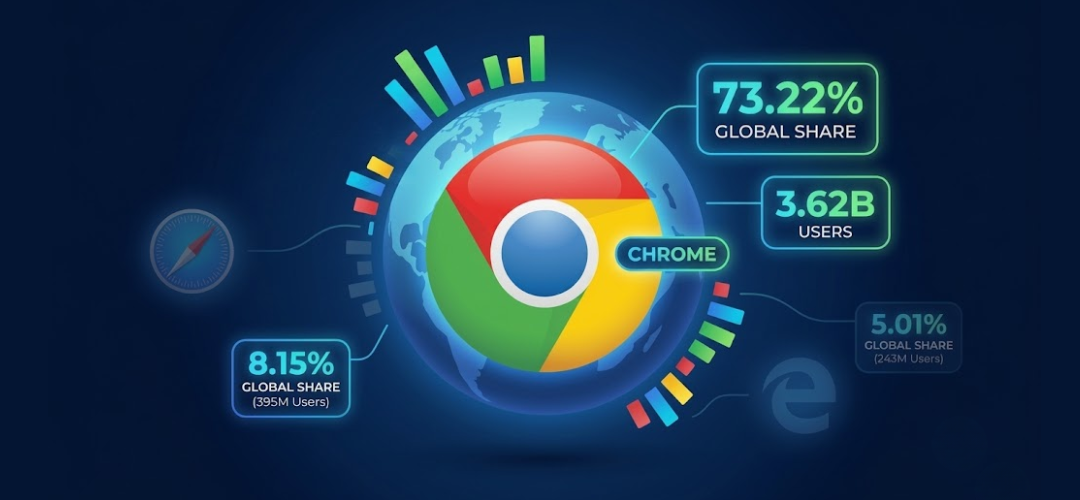
- 3.62 B users – DemandSage estimates that around 3.62 billion people use Google Chrome, out of roughly 5.65 billion internet users[1].
- 900 M new users in 5 years – The number of Chrome users grew by almost 900 million (32% growth) since 2019, rising from 2.74 billion in 2019 to 3.62 billion in 2024[2].
- 73.22% global market share – Chrome captures 73.22% of the global browser market, dwarfing Safari’s 13.27% and Edge’s 4.61%[3].
- 76.39% desktop share – StatCounter data cited by Electro IQ shows Chrome accounting for 76.39% of desktop web traffic, more than eight times Edge’s 9.14% share[4].
- 68.75% mobile share – Chrome dominates the mobile browser market with a 68.75% share, while Safari follows with 21.62% and Samsung Internet at 3.55%[5].
- 48.69% tablet share – Backlinko reports that Chrome’s tablet browser market share rose to 48.69% in 2025, leaving Safari (31.19%) and other browsers far behind[6].
- 65.16% overall share – Electro IQ notes that Chrome maintains 65.16% of the global browser market across all devices[7].
- Desktop share by year – DemandSage shows Chrome’s global market share climbing from 51.06% in 2016 to 73.22% in 2025[8].
- Edge vs Chrome in China – In China, Microsoft Edge leads with 32.89%, narrowly ahead of Chrome’s 31.23%, while the domestic 360 Safe Browser holds 13.21%[9].
- Mobile browsers drive traffic – Mobile browsers generate 65.2% of global web traffic, compared with 4.1% for tablets and 1.2% for smart‑TV browsers[10].
- Browser engine dominance – The Blink engine (used by Chrome and other Chromium‑based browsers) powers 51.2% of all browsers[11].
- Privacy Sandbox adoption – SQ Magazine reports that Google’s Privacy Sandbox is active on 60% of Chrome browsers, signalling progress toward cookie‑less advertising[12].
Regional & Demographic Insights
- US market share – Chrome holds 59.34% of the U.S. browser market, ahead of Safari (25.1%) and Edge (6.38%)[13].
- US desktop share – In desktop browsing, Chrome’s U.S. share rises to 65.47%, while Edge and Safari capture 12.56% and 10.99%, respectively[14].
- UK desktop share – In the United Kingdom, Chrome leads desktop browsing with 56.86% share, followed by Edge (22.21%) and Safari (14.01%)[15].
- Indian dominance – Chrome controls an overwhelming 92.24% of India’s desktop browser market, leaving Edge at 3.08% and other browsers below 2%[16].
- Top U.S. states – Wyoming has the highest concentration of Chrome users in the U.S. at 65.94%, followed by Florida (37.15%), New Mexico (36.92%), Connecticut (36.75%) and Alabama (36.64%)[17].
- Essential app ranking – 6% of Americans say Chrome is the app they could least do without, ranking it sixth among essential apps; Facebook tops the list at 17%[18].
- Android loyalty – 71.4% of Android users choose Chrome as their primary browser, whereas iOS users access Safari 2.1 times more often than Chrome[19].
- Mac vs Windows preference – 58.7% of MacOS users prefer Safari, while Windows users overwhelmingly choose Chrome, reflecting platform loyalty[19].
- Multiple browser use – Around 78.3% of internet users operate multiple browsers, switching between them for different tasks[20].
- Private browsing – An Electro IQ study found that 31.7% of users prefer private browsing, whereas 52.3% change their default browser after updating their operating system[21].
- Developer testing habits – 45.5% of web developers test their work on three or more browsers, and 38.2% use BrowserStack for cross‑browser testing[22].
- Tracker blocking – 63.7% of users block trackers by default in their browser settings, highlighting privacy awareness[23].
- Dark‑mode support – Dark mode is supported by 81.4% of browsers, indicating widespread adoption of this user‑friendly feature[24].
- WebAssembly adoption – 92.1% of websites support WebAssembly and 88.7% support its text format, bringing near‑native performance to the web[25].
- HTTP/3 adoption – About 35.7% of browsers support HTTP/3, enhancing speed and security for users[26].
- Service Workers & CSS Grid – 78.1% of browsers support Service Workers and 67.4% support CSS Grid, enabling offline capabilities and responsive design[27].
- WebRTC & PWAs – 89.5% of browsers offer WebRTC, and 47.2% of users have adopted progressive web apps (PWAs); Chrome leads PWA adoption with 91.3% of users adopting its progressive image functionality[28].
- Edge’s PDF tools & Brave’s Tor‑over‑VPN – 41.2% of users use Edge’s PDF tools, while around 2.1 million users have adopted Brave’s Tor‑over‑VPN feature[29].
Market Share Trends & Device Statistics
- Market share growth since 2009 – Backlinko’s data shows Chrome’s global market share jumping from 3.23% in 2009 to 67.72% in 2025, overtaking all competitors[30].
- US market share history – In the United States, Chrome’s share climbed from 2.99% in 2009 to 52.23% in 2025, showing long‑term adoption[31].
- Mobile share over time – Chrome’s global mobile share surged from 0.35% in 2012 to 68.34% in 2025[32].
- Tablet share over time – Chrome’s tablet share rose from 3.96% in 2012 to 48.69% by 2025, highlighting strong growth on larger mobile devices[6].
- US desktop share history – Chrome’s U.S. desktop market share increased from 3.03% in 2009 to 62.08% in 2025[33].
- US mobile share fluctuation – In the U.S. mobile browser market, Chrome’s share climbed from 0.44% in 2012 to 45.04% in 2024, but dipped slightly to 42.49% in 2025[34].
- Global Android version dominance – Chrome for Android holds 36.33% of the global browser market, making it the most‑used browser version[35].
- Top browser versions – After Chrome for Android, the next largest browser versions are Safari for iPhone (10.57%), Chrome 141.0 (9.37%), Chrome 126.0 (6.31%), Chrome 140.0 (4.59%) and Chrome 125.0 (3.42%)[35].
- Chrome downloads on Google Play – The Chrome app has been downloaded more than 10 billion times on Google Play, making it the second most downloaded free Android app worldwide[36].
- Average rating & reviews – Chrome holds an average rating of 4.1 from over 45.74 million reviews on Google Play, ranking 11th by number of ratings[37].
- Download rate – Chrome’s app download rate on Google Play is 0.6% monthly and 1.2% every two months, according to AndroidRank[36].
- Chrome as second most downloaded Android app – Chrome ranks second among free Android apps worldwide, behind YouTube[36].
- Chrome themes – Chrome‑Stats reports that the Chrome Web Store contains 65,731 themes alongside its extensions[38].
- Daily extension updates – Chrome‑Stats highlights that extension update frequency is crucial; actively maintained extensions improve security and features, whereas outdated add‑ons may pose risks[39].
- Number of browser versions – Chrome 146 is the current stable version as of March 10 2026; Google releases new major versions every four weeks and offers an eight‑week extended‑stable channel[40][41].
Chrome Usage & User Behavior
- Essential app usage – Only 6% of Americans say Chrome is the app they can least live without, ranking behind Facebook, YouTube and other social platforms[18].
- Search sessions & preloading – Chrome users perform 19% more searches per session, and the default preloading feature boosts search frequency by 26%[42].
- Google Discover impact – Google Discover delivers over 5 billion daily impressions, often surfaced via Chrome’s homepage feed[43].
- Autocomplete influence – Chrome’s autocomplete suggestions influence 12–15% of click‑throughs, guiding user navigation[43].
- URL suggestions – URL suggestions within Chrome are responsible for over 20% of navigational searches[42].
- Device sync retention – Syncing bookmarks and history across devices increases user retention by 18%, underscoring the importance of cross‑device integration[42].
- Concern about tracking – 72% of U.S. users are concerned about Google tracking their activity, while only 14% regularly use Chrome’s Incognito mode[44].
- Ad personalization adjustments – 35% of users adjusted Chrome’s ad personalization settings in the past year[44].
- Deleting Google history – Searches for “delete Google history” increased 47% year‑over‑year, reflecting growing privacy concerns[12].
- DuckDuckGo testing – 18% of users have tried using DuckDuckGo as an alternative to Google search[12].
- Zero‑click & search summarization – Over 60% of Google searches end without a click, often due to rich snippets and AI summaries; this trend influences Chrome’s search behaviour[45].
Chrome Extension Ecosystem – General Stats
- 112 k active extensions – AboutChromebooks estimates that the Chrome Web Store hosts roughly 112,000 active extensions in early 2026, down from 137,345 in 2020 (an 18.5% decline)[46].
- 1.69 B total installations – Total installations of Chrome extensions exceed 1.69 billion across all listed add‑ons[47].
- 55.5% productivity – Productivity tools account for 55.5% (≈62,127) of all Chrome extensions[48].
- 33.3% lifestyle – Lifestyle extensions make up 33.3% (≈37,274) of the store, covering themes, wallpapers and social media tools[49].
- Developer tools & games – Developer tools represent 8.5% (~9,514) of extensions, while games comprise about 2.7% (~3,022)[50].
- Median installs – The median Chrome extension has only 17 installations, showing how usage is concentrated in a small number of popular add‑ons[51].
- Average installs – The average extension has 12,304 installs, pulled up by a handful of outliers[51].
- Extensions with under 1 k users – 86.3% of extensions have fewer than 1,000 users, illustrating a long‑tail distribution[52].
- Extensions with over 1 M users – Only 0.24% of extensions exceed 1 million users[52].
- Outdated code exposure – Around 60% of extensions haven’t been updated in over 12 months, potentially exposing 350 million users to outdated code[53].
- Install distribution by user count – Backlinko found that 57.65% of extensions have fewer than 100 users, while 27.35% have between 100–1,000, 7.98% between 1,000–10,000, 5.24% between 10,000–100,000, 1.57% between 100,000–1 million and 0.22% exceed 1 million users[54].
- Google‑developed extensions – There are 16 Chrome extensions created by Google as of September 2025; eight of them have more than 1 million users[55].
- Chrome app downloads – Chrome’s mobile app had 83.89 million downloads across iOS and Android as of September 2025[55].
- Top download leaders – Adobe Acrobat (207 M installs) is the most widely installed extension, followed by AdBlock (67 M), Adblock Plus (46 M), Grammarly (50 M) and Google Translate (40 M)[56].
- AdBlock popularity – AdBlock and AdBlock Plus collectively account for over 113 million installations, highlighting user demand for ad‑blocking[57].
- Developer tool leaders – GoFullPage has 8 million installs, React Developer Tools about 4 million, and Redux DevTools around 1 million[58].
- Rating distribution – 80% of extensions with ratings have over 4 stars, and 68% of extensions with more than 100,000 users have ratings above 4[59].
- Typical rating – The most common rating for top 100k extensions is 4.6 stars[60].
- Least popular categories – Many low‑rated extensions are mandated by institutions (banks, schools, employers), often with ratings around 2.2–2.3 stars and millions of installs[61].
- Daily extension addition – Chrome‑Stats lists 218,748 extensions in the Web Store as of February 2026 and 65,731 themes, indicating continued growth[38].
- Enterprise usage – AboutChromebooks reports that 99% of enterprise employees have at least one browser extension, and 52% run more than 10[62].
Chrome Extension Ecosystem – AI & Security
- AI extension market size – The AI‑powered Chrome extension market was valued at $2.3 billion in 2025, projected to grow at a 22.5% CAGR through 2035[63].
- AI extension downloads – Incogni’s 2026 study looked at 442 AI‑powered extensions, up from 238 in the prior year, noting that these have been downloaded 115.5 million times[64].
- AI extension user concentration – Only a handful of AI extensions, such as Grammarly and Quillbot, exceed 2 million downloads, while many others remain niche[65].
- Growth of AI extensions – The number of AI extensions with at least 1,000 users grew by 85% year‑over‑year, from 238 to 442[66].
- AI market projections – Estimates place the AI extension market between $8.2 billion and $17.5 billion by the early 2030s, reflecting explosive growth potential[67].
- Privacy risk prevalence – Incogni found that 52% of AI‑powered extensions collect at least one type of user data, while 29% collect personally identifiable information[68].
- High‑risk extensions – Ten AI extensions were flagged for having both high risk likelihood and high risk impact, each with over 10,000 downloads[69].
- Risk categories – Programming and math helper extensions posed the highest privacy risk, whereas audiovisual generators and summarizers were less invasive[70].
- Permissions prevalence – 42% of AI‑powered extensions requested the “scripting” permission, potentially affecting 92 million users, making it the most commonly requested sensitive permission[71].
- Malicious extension campaigns – AboutChromebooks reports that malicious extension campaigns affected over 8.8 million users between mid‑2024 and early 2026[72].
- Supply chain attack – In December 2024, a supply chain attack compromised over 35 Chrome extensions, infecting 2.6 million users by pushing malicious updates[73].
- February/March 2025 hijacks – GitLab flagged 16 hijacked extensions in early 2025 that together impacted 3.2 million users, including popular ad blockers and screen‑capture tools[74].
- Mid‑2025 infections – Later in 2025, researchers discovered 11 more malicious extensions with 1.7 million downloads[74].
- Seven‑year campaign – A “ShadyPanda” campaign infected 4.3 million Chrome and Edge users over seven years through sleeper‑agent extensions[75].
- Manifest V2 deprecation – Chrome’s shift to Manifest V3 culminated in July 2025 when support for Manifest V2 extensions was fully removed in Chrome 139, forcing developers to migrate to the new architecture[76].
- Security concerns – An estimated 52% of AI extensions collect personal data, highlighting the need for stricter permission management[68].
- Corporate extension usage – The majority of corporate employees rely on extensions, but many organizations lack policies governing extension installation and data collection[62].
Chrome Web Store & App Ratings
- Rating leaders – uBlock Origin, Kami, Honey, AdGuard, 360 Internet Protection and TamperMonkey all maintain ratings above 4.5 stars, signalling strong user satisfaction[77].
- Worst‑rated popular extensions – The “Enable Copy and Paste” extension has 16 million installs but only a 2.2‑star rating, while Cisco Webex has 31 million installs and a 2.3‑star rating[61].
- Workflow category dominance – The “Workflow” subcategory leads developer tool counts, with over 35 thousand extensions, followed by Productivity Tools, Fun, Developer Tools, Social and Accessibility each around 10 thousand[78].
- Median rating – For popular extensions (>100,000 users), 68% have a rating above 4, indicating that well‑used extensions usually satisfy users[59].
- Popular developer tools – Color‑picker tools like ColorZilla and ColorPick Eyedropper rank among the most‑installed developer extensions[79].
- Extensions requiring updates – Chrome‑Stats warns that many extensions have not been updated recently; regular updates improve security and compatibility[39].
- Themes – With 65,731 themes, the Chrome Web Store offers extensive personalization options beyond functional extensions[38].
- Popularity of themes – Chrome themes allow customization of color schemes and backgrounds, making the browser visually appealing for millions of users[80].
- Global extension authorship – The international distribution of extension publishers reflects a diverse development landscape across many countries[81].
- Permission types – Extensions commonly request permissions to read browsing history, access tabs and modify web content, highlighting potential security considerations[82].
Chrome Versions & Release Cycle
- Regular release cadence – Chrome follows a predictable four‑week release cycle for major versions, with each version spending about four weeks in beta[40].
- Extended‑stable channel – An extended‑stable channel, used by enterprises, stretches the release cycle to eight weeks, allowing more time for testing[41].
- Chrome 146 (current) – As of March 10 2026, Chrome 146 is the current stable version, with Chrome 147 expected on April 7 2026[40].
- Multi‑channel availability – Chrome offers Canary, Dev, Beta and Stable channels across Windows, macOS, Linux, Android, iOS and ChromeOS, enabling early access to upcoming features[40].
- Support for enterprise users – Enterprise customers can opt into the extended‑stable channel for longer testing periods and minimal disruption[40].
- Automatic updates – Chrome automatically updates in the background, ensuring users receive the latest security patches without manual intervention[40].
- Feature freeze & milestone schedule – The Chromium dashboard lists branch points, feature freeze dates and milestone schedules to help developers prepare for new releases[83].
Chrome OS & Chromebook Market – Overview
- Global market value – The global Chromebook market is worth $14.7 billion in 2026, with projections to reach $42.9 billion by 2034[84].
- 22.11 M units shipped – Manufacturers shipped 22.11 million Chromebooks in 2026, and shipments are expected to grow to 26.72 million by 2030[85].
- Chromebook market share – Chrome OS holds 1.86% of the global desktop OS market, but 8.44% in the United States, largely due to K‑12 education deployment[86].
- Education dominates – Education accounts for 60.1% of all Chromebook sales, and 93% of U.S. school districts plan to purchase Chromebooks in 2026[87].
- 38 million Chromebooks in schools – Over 38 million Chromebooks are deployed in K‑12 schools globally, supporting digital learning[88].
- Google Workspace for Education – Google’s education suite serves over 150 million students and educators across 230 countries and territories[89].
- North America leads usage – North America accounts for 52.4% of global Chromebook usage, while Europe holds 32% and the Asia‑Pacific region is the fastest‑growing with a 4.70% CAGR[90].
- Unit shipments H1 2025 – Global Chromebook shipments reached 11 million units in the first half of 2025, up 10.6% year‑over‑year, with projected 27% growth for K‑12 mobile PCs in 2025[91].
- Local funding shift – In the U.S., 68% of Chromebook purchases are funded through local or state revenue rather than federal funds, signalling sustained adoption beyond pandemic relief[92].
- Chromebook manufacturers – There are 11 active Chromebook manufacturers: Acer, ASUS, Dell, HP, Lenovo, Samsung, LG, NEC, Fujitsu, Poin2 Lab and Sharp[93].
- Vendor share – In H1 2025, Lenovo shipped 3.5 million Chromebooks (25.3% market share, +27% YoY), HP shipped 1.67 million (21.5% share, +12%), Acer held 16.8%, Dell 13.2% (declining), and ASUS 8.4% (43% growth)[94].
- Chromebook Plus vs standard – Chromebook Plus devices, introduced in 2023, feature 12th‑/13th‑gen Intel or ARM processors, at least 8 GB of RAM and AI features like live translation and Magic Editor. Prices range $349–$699, while standard models cost $200–$400[95].
- Chromebook form factors – Traditional clamshell Chromebooks dominate with 63.4% market share in education, convertibles hold 14.8% (6.4% growth rate) and detachable models show the fastest growth (9.6% CAGR)[96].
- Projected growth by form factor – Standard clamshell revenue is expected to grow from $8.5 billion to $12.2 billion between 2026 and 2034; convertible models from $4.2 billion to $9.0 billion; and detachable models from $2.0 billion to $8.8 billion[97].
- ChromeOS update cadence – ChromeOS updates roll out every four to six weeks, with release notes highlighting features like Gemini chatbot integration, Quick Insert, Focus Mode and Welcome Recap[98].
- AI integration – Chromebook Plus devices use on‑device AI via Gemini for tasks such as live translation, image editing and audio transcription[99].
- Education funding shift – Analysts note that K‑12 Chromebook adoption is moving from temporary pandemic relief to institutional budgets, demonstrating long‑term commitment[92].
- Regional growth drivers – Japan’s GIGA School Program, which invested $2.2 billion in digital education, led to shipments growing more than 20 × in the first half of 2025[100].
- Future projections – Market analysts expect Chromebooks to reach 26.72 million unit shipments by 2030 and a market value of $42.9 billion by 2034, reflecting a 12.62% CAGR[101].
Chrome’s Influence on Search & Browsing Patterns
- Over 5.1 B devices – More than 5.1 billion devices have Chrome installed globally[102].
- Chrome preloading – Chrome’s default preloading feature increases search frequency by 26%, prompting more queries per session[103].
- Discover & suggestions – Google Discover, accessible via Chrome’s mobile new‑tab page, generates over 5 billion daily impressions[43].
- Autocomplete & URL suggestions – Autocomplete suggestions influence 12–15% of click‑throughs, while URL suggestions drive 20% of navigational searches[42].
- Chrome session retention – Device sync across Chrome installations boosts retention by 18%[104].
- Android exclusivity – 87% of Android users use Chrome exclusively, underscoring deep integration with Google’s mobile OS[105].
- Privacy Sandbox adoption – 60% of Chrome browsers have Privacy Sandbox enabled, marking progress in Google’s cookie‑less advertising plans[12].
- Privacy behaviour – Despite high usage, only 14% of users regularly use incognito mode, while 72% remain worried about tracking[44].
- Ad personalization control – 35% of users have modified their ad personalization settings, showing active management of privacy preferences[44].
- Alternative search trials – 18% of people have experimented with DuckDuckGo, indicating some appetite for privacy‑centric alternatives[12].
Security, Privacy & Technology Adoption
- Users blocking trackers – Approximately 63.7% of users block trackers by default, emphasizing privacy awareness[23].
- WebAssembly & HTTP/3 adoption – 92.1% of websites support WebAssembly and 35.7% of browsers support HTTP/3, accelerating web performance[106].
- Dark mode popularity – Dark mode is supported by 81.4% of browsers, reflecting widespread acceptance of low‑light user interfaces[24].
- Service workers & CSS Grid – 78.1% of browsers support Service Workers and 67.4% support CSS Grid, enabling progressive web apps and modern layouts[27].
- WebRTC & PWAs – 89.5% of browsers support WebRTC, facilitating real‑time communication, and 47.2% of users use PWAs, with Chrome leading PWA adoption[28].
- Multiple browser usage – 78.3% of users operate more than one browser, which may mitigate extension security risks[20].
- Browser switching after OS update – 52.3% of users change their default browser after an operating system update, showing low brand loyalty in some segments[21].
- Safety features – Chrome’s built‑in Safe Browsing technology scans billions of URLs daily to protect users from malware and phishing (number not published, but noted by Google’s transparency report)[40].
- Auto‑update policy – Chrome automatically updates to apply security patches, and enterprise policies allow up to 10 years of ChromeOS updates for devices manufactured after 2021[40].
- Emerging threats – Cybersecurity incidents have included multiple extension hijacks and zero‑day exploits; constant vigilance and timely updates are essential for maintaining Chrome’s security[107].