100 Additional SEO Statistics for 2026
Search behaviour is continuing to evolve rapidly, with AI platforms, mobile devices and local searches reshaping how people discover information and businesses. These SEO statistics, gathered from credible 2025–2026 sources, complement the earlier report by adding 100 new, non‑overlapping data points across ranking, AI search, keywords, content, technical SEO, link building, voice search, mobile trends, video, local search, market size and e‑commerce. Each fact below is tied to a published source[1][2].
Search engine optimisation remains one of the most effective ways to attract visitors, leads and sales, but the landscape is changing fast. To stay competitive, marketers need to understand how search engines, content and consumer behaviour are evolving. The statistics below summarise where SEO stands in 2026—covering industry growth, ROI, search behaviour, mobile and local search, the impact of AI, on‑page and technical optimisation, link building, emerging technologies, visual and e‑commerce trends, salaries and the role of social media. Each fact is drawn from credible 2025–2026 reports and studies[1][2].
General search & user behaviour
- The average internet user performs 3–4 searches per day, and 50 % of Google searchers click on a result within 9 seconds[3].
- Only 1 % of webpages receive more than 10 clicks per month[4].
- Organic search accounts for 46.98 % of total website traffic, down 3.65 % in 2025[5].
- Search‑intent distribution shows 70 % of queries have informational intent, 22 % commercial, 7 % navigational and 1 % transactional[6].
- In 2025 the top U.S. websites by traffic were Google, YouTube, Wikipedia, Reddit and Facebook[7].
- About 21.1 % of Google.com traffic originates from the United States, followed by Japan (6.46 %) and India (5.58 %)[8].
- The top 10 000 Google queries represent 46 % of total search demand, with just 148 terms generating nearly 15 % of all volume[9].
- Approximately 23 % of users choose a suggestion from Google’s autocomplete when typing their query[10].
- Digital marketers continue to value SEO—91 % say their SEO work positively impacted website performance in 2024[11].
- Google dominates search with an 82.24 % market share; Bing has 10.67 %, Yahoo 2.69 % and Yandex 2.18 %[12].
Ranking & click‑through statistics
- Google uses over 200 ranking factors, with high‑quality content, backlinks and search intent continuing to be the top three[13].
- The #1 organic result captures 39.8 % of all clicks[14].
- If the first result is a featured snippet, its click‑through rate (CTR) rises to 42.9 %[15].
- Moving from position 2 to position 1 on Google generates 74.5 % more clicks, and climbing any single position increases CTR by 32.3 %[16].
- Rich results (e.g., video or featured snippets) attract 58 % of clicks compared with 41 % for non‑rich results[17].
- The top three organic results garner 68.7 % of all clicks[18].
- The #1 result is 10 × more likely to be clicked than a result in position 10[17].
- Only 0.78 % of searchers click on Google’s second page[19].
- “Related Searches” is the most common SERP feature, appearing on 85 % of results pages; Review rich results appear in 79 % of cases[20].
- Conversion rates vary by page type: white papers convert at 4.6 %, case studies 3.5 % and landing pages 3.1 %[21].
AI & generative search statistics
- AI search traffic increased by 527 % between early 2024 and early 2025[22].
- Analysts expect AI search traffic to surpass traditional organic search by 2028[23].
- Google’s AI Mode is available in over 200 countries and territories and already has around 100 million users in the US and India[24].
- Google AI Overviews reach 2 billion monthly users and appear in many query types[25].
- More than 88 % of queries that trigger AI Overviews are informational; commercial queries represent 8.69 %, transactional 1.76 % and navigational 1.43 %[26].
- 68 % of keywords that trigger AI Overviews have 100 or fewer monthly searches, and nearly 80 % fall into an easy (0–40 %) difficulty range[27].
- When an AI summary is present, only 8 % of users click a regular result below it; without the summary, 15 % click[28].
- About 26 % of searches with AI summaries end without any further action, compared with 16 % for standard results[29].
- Appearing as a cited source in an AI Overview increases CTR from 0.6 % to 1.08 %, according to a study of 7 800 queries[30].
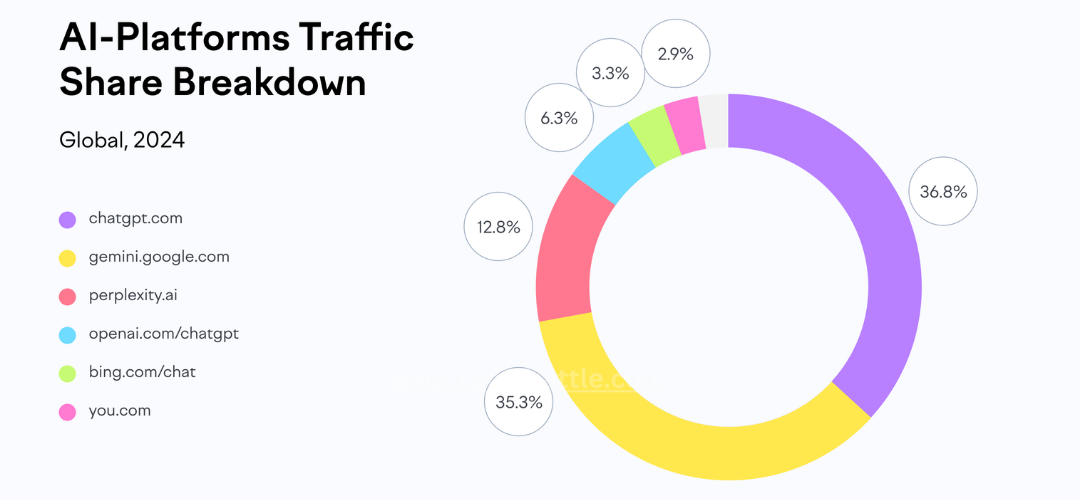
- Around 50 % of ChatGPT’s cited links point to business and service websites; news/media sites account for 9.5 %, blogs 8.3 % and e‑commerce 7.6 %[31].
- ChatGPT users click an average of 1.4 external links per visit, compared with 0.6 for Google users[32].
- Visitors referred by AI platforms have a 27 % lower bounce rate than those from traditional search and spend 38 % longer on retail sites[33].
- 80 % of consumers use AI summaries for at least 40 % of their searches[34].
- About 70 % of users read only the first third of an AI overview[35].
- Over 80 % of users are at least somewhat skeptical of AI overviews; only about 9 % always trust them[36].
- Only 19 % of users click through to the sources cited in AI summaries[37].
- Nearly 35 % of U.S. Gen Z users rely on AI chatbots to search for information[38].
- More than 40 % of users report seeing inaccurate or misleading content in AI overviews[39].
- AI‑written pages now appear in over 17 % of top Google search results, up from 2.27 % in 2019[40].
- About two‑thirds of AI‑generated content ranks within two months of publication[41].
AI adoption & content creation
- ChatGPT has roughly 700 million weekly active users and more than 5 billion monthly visits[42].
- Adoption rates of ChatGPT in low‑income countries are over four times higher than in high‑income countries[43].
- Nearly 70 % of businesses report higher ROI after integrating AI into their SEO and content workflows[44].
- Almost 47 % of e‑commerce sellers use AI to write product descriptions[45].
- 80 % of consumers use AI summaries for at least 40 % of their searches (reinforced in AI user behaviour section)[34].
- Over 60 % of searches now result in no clicks because AI summaries and SERP features answer the query on the page[46].
- Visitors arriving from AI searches are 4.4 × more valuable than those from traditional organic search, based on conversion metrics[47].
- AI‑generated product descriptions, used by nearly half of online sellers, are especially valuable for stores with thousands of items[48].
Keyword & search‑query statistics
- 34.71 % of Google queries consist of four or more words[49].
- 94.74 % of keywords have 10 or fewer monthly searches, while just 0.0008 % exceed 100 000 searches[50].
- Titles containing question‑based keywords have a 15.5 % CTR, whereas titles without questions average 16.3 %[51].
- 74 % of keywords receive 10 or fewer searches per month and only 0.024 % get more than 100 000 searches[52].
- Web pages with titles between 40 and 60 characters achieve the highest CTR[53].
- Including target keywords in a URL increases CTR by 45 %[54].
- Approximately 44 % of Google searches are branded, while 56 % are unbranded or generic[55].
- The most visited websites in the U.S. rank for an average of 143.4 million keywords, and YouTube ranks for 301 million keywords[56].
- “YouTube” was again the most searched keyword in 2025[57].
- Google rewrites meta titles that are too long 57 % of the time[58].
- Approximately 25.02 % of top‑ranking pages lack a meta description[59].
- 32 % of website owners allow AI platforms to access their content, while 29 % restrict specific platforms and 11 % block AI scrapers[60].
Content & on‑page optimisation statistics
- Guides and ebooks (27 %) and webinars (26 %) are among the highest‑performing content formats[61].
- 48 % of marketers publish new content two to four times per month[62].
- Most blog posts include rich media: 88 % contain images, 60 % use statistics, 45 % feature contributor quotes and 26 % embed videos[63].
- The average blog post is about 1 333 words long[64].
- Companies that use AI produce 42 % more content monthly (17 articles) than those that do not (12 articles)[65].
- Content marketers use AI for idea generation and editing (66 %), headline writing (58 %) and outlining (54 %)[66].
- 11.3 % of content marketers plan to invest over $45 000 per month in content marketing, up from 4.1 % in 2024[67].
- The majority of keywords used by content marketers are extremely low‑volume; nearly three‑quarters of keywords get ≤10 searches per month[52].
- Titles between 40–60 characters deliver the highest CTR, and URLs containing target keywords increase CTR by 45 %[68].
Technical SEO statistics
- Only 54.6 % of websites meet Google’s Core Web Vitals requirements[69].
- About 23 % of websites do not link their XML sitemap in robots.txt, while 17 % have sitemaps with redirecting URLs (3xx) and 15 % are missing a sitemap entirely[70].
- Just 26 % of websites include alt text on images[71].
- 36 % of sites use oversized images that slow down pages[72].
- Around 50 % of sites have duplicate meta descriptions, and 54 % have duplicate title tags[73].
- Among sites with CSS problems, 58 % have oversized files, 49 % use uncompressed files, 44 % lack minification and 18 % don’t enable caching[74].
- 36 % of websites have pages returning 4xx errors, and 18 % contain broken images[75].
- Minification of JavaScript files is one of the most common technical issues, affecting roughly half of websites[76].
- 98.9 % of websites use JavaScript on the client side[77].
- Only 18 % of websites enable CSS caching, leaving most sites without this optimisation[74].
Link‑building & backlink statistics
- Approximately 40.7 % of SEOs believe content marketing is the most effective method for long‑term link building[78].
- On average, 63 % of backlinks point to a site’s homepage, leaving just 37 % for internal pages[79].
- Roughly 30 % of backlinks carry medium or high toxicity, posing a risk to rankings[80].
- 52.7 % of SEOs consider service and product pages the most important targets for link acquisition[81].
- About 80 % of SEOs say a backlink takes 2–6 weeks to impact search rankings[82].
- The cost of acquiring a link ranges widely—from under $200 up to $1 200 per link[83].
- Most businesses estimate the lifetime value of a link to be between $5 000 and $15 000[84].
- 86 % of guest‑posting sites are low quality (≤10 K monthly traffic and DR < 40)[85].
- A large majority (91.9 %) of SEOs believe their competitors buy backlinks, even though the practice violates Google’s guidelines[86].
- The share of content marketers who said link‑building played a significant role in their strategy dropped from 73.3 % in 2024 to 53.3 % in 2025[87].
Voice‑search statistics
- There are now 8.4 billion voice assistants in use globally—double the number in 2024[88].
- Users perform more than 1 billion voice searches per month[89].
- 71 % of internet users prefer using voice search over typing queries[90].
- Mobile users are three times more likely to use voice search than desktop users[91].
- 50 % of mobile users perform a voice search every day[92].
- The average voice search result is 29 words long[93].
- 40.7 % of voice‑search answers come from featured snippets[94].
- The global voice recognition market is projected to grow from $12 billion in 2022 to nearly $50 billion by 2029[95].
- Pages that rank for voice search have an average of 2 312 words[96].
Mobile search & device statistics
- Mobile internet traffic makes up roughly 60 % of all web traffic[97].
- Mobile devices generate 58 % of all Google searches[98].
- 56 % of shoppers use their smartphone to shop or research products while in‑store[99].
- Nearly 70 % of local searches originate from a mobile device[100].
- 76 % of users who perform a mobile local search visit the business within 24 hours, and 28 % of those visits lead to a purchase[101].
- The average person spends 5 hours 16 minutes per day on their phone (excluding calls)[102].
- 16 % of internet users are “smartphone‑dependent,” relying on their phone as their primary internet connection[103].
- There are 5.78 billion unique mobile users, representing 70.1 % of the global population[104].
- Since 2020, mobile devices have consistently delivered over 50 % of global web traffic, peaking at 62.73 % in 2025[105].
- Google holds a 94.35 % share of the mobile search market; Yandex has 2.03 % and Baidu 0.83 %[106].
- Mobile users spend an average of 5 hours 16 minutes per day on their devices[107].
- AI‑related mobile apps now generate over 17 billion downloads, up from 5 billion in 2019, and ChatGPT alone has been downloaded 903 million times[108].
- Video apps account for 75.9 % of global mobile data consumption[109].
- By 2028, 70 % of worldwide digital advertising revenue is expected to come from mobile platforms[110].
Video & visual SEO statistics
- Web pages containing video drive 157 % more organic traffic than pages without video[111].
- Video content achieves a 41 % higher CTR than text‑only content[111].
- Google displays video thumbnails in 26 % of search results[112].
- Video content is 50 times more likely to rank on Google’s first page compared with plain text[113].
- There is a positive correlation between the likes, comments and shares a video receives and its YouTube ranking[114].
- “ASMR” was the most searched term on YouTube in 2025, with 28 million global searches[115].
- 89 % of businesses report using video as a core component of their marketing strategy[116].
- 93 % of marketers say video campaigns deliver a positive ROI[117].
Local SEO statistics
- Roughly 46 % of monthly Google searches have local intent[118].
- 86 % of people look up a business’s location on Google Maps[118].
- 99 % of consumers read online reviews before purchasing[119].
- 46 % of consumers trust online reviews as much as personal recommendations[120].
- 18 % of local mobile searches lead to a purchase within one day[121].
- 74 % of consumers check reviews on two or more sites before choosing a local business[122].
- On the review platforms consumers use, 83 % read reviews on Google, 44 % on Yelp and Facebook[123].
- 35 % of people use Instagram for local business information and 34 % use TikTok[124].
- 59 % of consumers will only consider businesses rated four stars or higher[125].
- 89 % of consumers are more likely to choose a business that responds to all reviews[126].
- 96 % of consumers are willing to write a review[127].
- Leading local ranking factors include dedicated service pages, geographically relevant content and high‑quality backlinks[128].
- When two people in different cities search the same “near me” query, only about 23 % of websites overlap in AI Mode results; adding a city name nearly doubles stability to 50–55 %[129].
Market size, salary & industry sentiment
- The average salary of an SEO professional in the United States is $70 300 per year[130].
- Typical hourly rates for SEO services range between $100 and $150[131].
- Monthly SEO retainers often fall between $500 and $1 000, with fees increasing for more experienced providers[132].
- About 64.5 % of SEO professionals reported receiving a pay raise in the past year[133].
- 40 % of marketers cite algorithm changes as their biggest SEO challenge[134].
- 74 % of small businesses invest in SEO, with average monthly services costing $497[135].
- 63 % of marketers say that Google AI Overviews have positively impacted organic traffic, visibility or rankings[136].
- The global SEO services market is valued at $83.98 billion in 2026 and projected to reach $148.86 billion by 2030[137].
E‑commerce & marketing statistics
- Free shipping is the top motivator for online purchases—50.7 % of shoppers cite it as their primary reason, followed by discounts or coupons (38.9 %) and positive reviews (32.2 %)[138].
- 19 % of product‑related searches result in a click on a Google Shopping listing[139].
- Google’s Shopping Graph updates more than 2 billion product listings every hour[140].
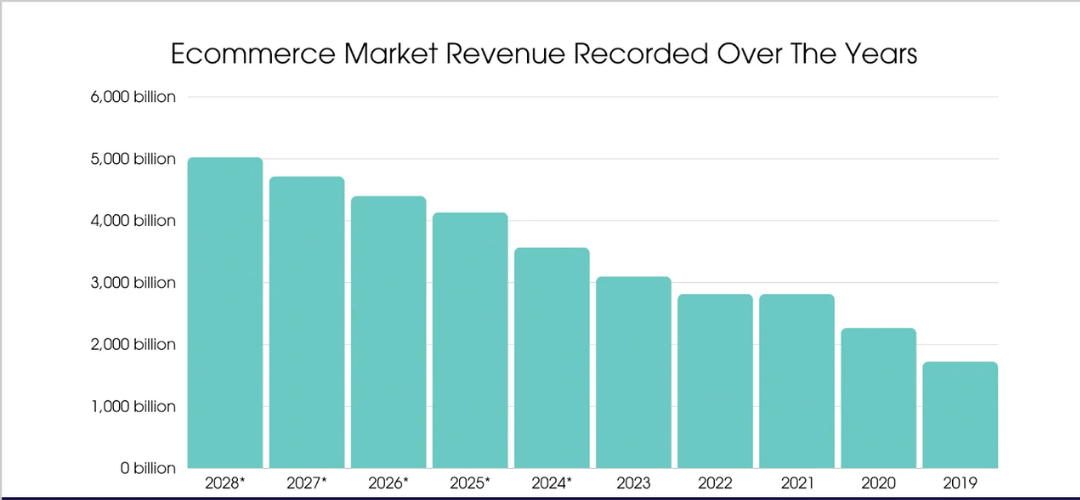
- Approximately 2 billion people shop online globally, generating $4.2 trillion in e‑commerce sales[141].
- Nearly 87 % of consumers say that watching a video influenced them to buy a product or service[142].
- Almost 50 % of e‑commerce sellers use AI to create product content (reinforcing AI adoption)[45].
These 100 statistics offer a comprehensive, up‑to‑date snapshot of the SEO landscape in 2026, highlighting the growing influence of AI, the importance of mobile and voice search, the power of video and local search optimisation, and the continued value of high‑quality content and backlinks. Marketers who adapt their strategies to these trends—especially optimising for AI overviews, mobile experiences and video content—will be better positioned to capture traffic and conversions in the evolving search ecosystem.
Industry growth & market trends
These figures highlight the continued expansion of the SEO industry and how user behaviour is reshaping search:
- The global SEO market is projected to grow at a compound annual rate of 8.3% from 2024–2030[3].
- 99% of marketing leaders report that non‑AI tools remain part of their SEO toolkit[4].
- Over 58% of Google queries in the US are zero‑click searches—searches where users don’t click any result[5].
- Google displays adverts on only about 20% of its search result pages[6].
- Organic search drives 53% of trackable website traffic, whereas social media drives just 5%[7].
- Google processes roughly 99 000 searches per second[8].
- Google commands over 90% of global search share, while Bing holds around 4%[9].
- Gartner predicts that total search‑engine volume will drop 25% by 2026 due to generative AI[10].
- About 15% of Google queries each day are completely new searches[11].
ROI and performance
Marketers continue to see high returns from SEO investments:
- A thought‑leadership SEO campaign can deliver a 748% return on investment (ROI)[12].
- B2B companies generate twice as much revenue from organic search compared with any other channel[13].
- 70% of marketers say SEO is one of the most effective channels for driving sales[14].
- The first organic result on Google has an average CTR of about 28%[15].
- Only 0.67% of searchers click on results on Google’s second page[16].
- 72% of enterprise‑level marketers report that SEO efforts successfully achieve objectives such as increasing web traffic[17].
- 57% of in‑house marketers cite a lack of SEO skills as their biggest obstacle[18].
- Nearly 97% of all websites receive no organic traffic from Google[19].
- Approximately 65% of searchers eventually click the traditional “10 blue links” on the first page[20].
Search engine & user behaviour
User behaviour and spending illustrate how integral search remains to daily life:
- Signed‑in users aged 18–24 generate the highest volume of Google searches[21].
- Google’s search products generated over $144 billion in revenue in the first three quarters of 2024[22].
- Google receives around 85 billion visits per month[23].
- The SEO industry was valued at nearly $107 billion in 2025[24].
- Businesses typically spend $500–$7 500 per month on SEO services[25].
- On average, marketing budgets equal 7.7% of company revenue, leaving limited funds for SEO[26].
- 61% of small businesses aren’t investing in SEO, yet 46% plan to start[27].
- Of the small businesses that do invest in SEO, 71% are satisfied with the results[28].
- Google is the #1 research touchpoint for consumers making purchase decisions[29].
- 70% of social‑media users head to Google to research products they first saw on social platforms[30].
Mobile & local SEO
The rise of smartphones and location‑based searches has reshaped SEO:
- About 95% of mobile searches in the United States happen on Google[31].
- The Google Maps app reaches 59% of U.S. smartphone users[32].
- “Near me” searches on Google Maps have grown 100% year‑over‑year globally[33].
- 21% of consumers use the internet daily to find a local business[34].
- Companies with four‑star Google ratings outrank lower‑rated competitors by a median of 11%[35].
- Business directories appear in 31% of local‑intent search results, whereas business websites make up 61% of transactional local results[36].
- 42% of local searchers click results in the Google Maps Pack[37].
- Two‑thirds of U.S. consumers decide what to buy before they reach a store[38].
- Mobile search is the primary search method for 52% of Americans; this rises to 80% among Gen Z and 62% among millennials[39].
AI & SEO
Artificial intelligence is transforming SEO workflows and search results:
- 86% of SEO experts have integrated AI tools into their work[40].
- 67% of small businesses already use AI for content creation and SEO[41].
- Among surveyed businesses, 65% report better SEO results from using AI[42].
- 75% of marketers expect AI‑enabled search engines to positively impact their blogs[43].
- AI Overviews appear in up to 47% of Google searches[44].
- On mobile devices, AI Overviews and featured snippets can occupy more than 75% of the screen[45].
- 50% of U.S. adults say they would trust AI search results more if the content were verified by a human[46].
- Google’s AI Overviews reach over 1 billion searchers each month[47].
- 83% of marketers at companies with 200+ employees report that AI adoption has improved SEO performance[48].
Content & on‑page optimisation
Optimising titles, descriptions and content remains essential:
- Google rewrites 61% of meta titles when displaying search results[49].
- It also rewrites nearly 63% of meta descriptions[50].
- Meta‑description rewrites are more common on long‑tail keyword pages (65%) than on high‑volume pages (60%)[51].
- A technical SEO campaign focused on site fixes can achieve a 117% ROI[52].
- URLs containing keywords enjoy a 45% higher CTR than URLs without keywords[53].
- Nearly 60% of B2B marketers consider blogs their most valuable channel[54].
- Companies with blogs generate 67% more leads per month than those without blogs[55].
- The average page ranking in the top 10 on Google is more than two years old[56].
- About 25% of top‑ranking pages lack any meta description[57].
Technical SEO
Technical health can make or break search performance:
- Only 54.6% of websites meet Google’s Core Web Vitals requirements[58].
- 23% of websites fail to link their XML sitemap in robots.txt; 17% have sitemaps with redirecting URLs and 15% have no sitemap at all[59].
- Just 26% of websites use alt text for images, while 36% contain oversized images[60].
- 50% of sites have duplicate meta descriptions and 54% duplicate title tags[61].
- Among websites with CSS issues, 58% have oversized files, 49% use uncompressed files, 44% lack minification and 18% lack caching[62].
- 36% of websites have pages with 4xx errors and 18% contain broken images[63].
- Approximately 32% of site owners allow AI platforms to access their content; 29% restrict specific platforms and 11% block AI scrapers altogether[64].
- 98.9% of websites use JavaScript on the client side[65].
- Failing to minify JavaScript files is the top issue for roughly 50% of websites[66].
Link building & off‑page SEO
External links remain a powerful ranking signal but come with challenges:
- More than 66% of links pointing to sites over the past nine years are dead—a phenomenon known as “link rot”[67].
- Semrush’s backlink database contains over 43 trillion links[68].
- 41% of enterprise marketers say link building is the hardest part of SEO[69].
- Approximately 75% of link builders pay for links despite this practice violating Google’s guidelines[70].
- Link builders with more than five years’ experience generate about 25 links per month, whereas those with less than a year of experience produce 7 links per month[71].
- Top‑ranking pages acquire 5–14% more backlinks each month[72].
- Outreach campaigns that leverage social media achieve a 22% higher link‑building success rate[73].
- Roughly 95% of all web pages have zero backlinks[74].
Voice search & emerging technologies
Smart devices and visual search are changing how people discover information:
- 13% of U.S. consumers use smart speakers to make purchases[75].
- 20% of internet users worldwide rely on voice search[76].
- Nearly 64% of Gen Z and 62% of millennials are expected to use voice search by 2027[77].
- Only 13% of marketers planned to optimise for voice search in 2025[78].
- More than one in three Americans owns a smart speaker[79].
- 36% of consumers have used a visual search tool such as Google Lens while shopping[80].
- Visual searches grew 70% year‑over‑year worldwide[81].
- Google Lens handles 20 billion searches per month, with 4 billion of those being shopping‑related[82].
Video & visual marketing statistics
Video continues to dominate engagement and search results:
- In the United States, videos appear in 78% of Google search results[83].
- 94.6% of people watch online videos each week[84].
- 89% of businesses include video in their marketing strategies[85].
- 62% of video marketers report that using video reduces customer support inquiries[86].
- 51% of video marketers employ AI tools to create or edit videos[87].
E‑commerce & marketing
The intersection of search and online retail illustrates how SEO drives transactions:
- There are more than 24 million e‑commerce websites worldwide; the United States alone has about 12 million[88].
- 56.5% of internet users shop online each week[89].
- The top reasons consumers buy online are free shipping (50.7%), discounts/coupons (38.9%) and positive reviews (32.2%)[90].
- The most visited shopping sites are Amazon (2.71 billion visits/month), Temu (1.63 billion) and AliExpress (646 million)[91].
- 87% of consumers say watching a video influenced them to purchase a product or service[92].
- Roughly 2 billion people shop online, generating around $4.2 trillion in global e‑commerce sales[93].
SEO professionals & salaries
Compensation trends reveal the value of SEO expertise:
- The median annual salary for SEO specialists worldwide is about $51 680[94].
- U.S. SEO professionals earn roughly 60% more than their counterparts in the European Union[95].
- Freelance SEOs earn a median $58 000, compared with $50 675 for employed specialists[96].
- SEO managers earn 41.5% more than specialists without managerial responsibilities[97].
Social media & SEO
Social platforms increasingly overlap with search behaviour and results:
- Global social‑media users exceeded 5.66 billion in 2025[98].
- Social platforms account for 10.12% of global website traffic[99].
- Roughly 50% of Google search result pages include at least one social‑media platform; Reddit appears in 37% of results, YouTube in 19.8%, Quora in 8%, LinkedIn in 5% and Instagram in 2.6%[100].
- Facebook drives 76.56% of social‑referral traffic, while Instagram provides 6.72%, TikTok 5.50%, LinkedIn 2.97% and Pinterest 2.61%[101].
- TikTok’s search‑driven traffic increased fivefold during 2025 and it delivers a median engagement rate of 1.73%, far higher than Instagram (0.36%), Facebook (0.04%) or X (0.015%)[102].